The software for force-displacement measurement that leaves nothing to be desired.
Due to the consistent further development and continuous improvement of our test and measurement software KWM 3.0, we can now offer a comprehensive and powerful software.

FDM 3.0 with clear and functional user interface
In a clearly arranged user interface FDM 3.0 offers everything necessary for the force-displacement measurement and the extensive evaluation.
Test result, force-displacement diagram (as force/displacement diagram or force/time and displacement/time diagram), as well as the manual evaluation of the measurement data by means of cursor or zoom functionality, the archiving of the measurement results and even the complete measurement data are part of the standard.
The functions of the software
The software offers all the functions for use as an end-of-line test system, in series production, as well as for individual laboratory measurements or even random sampling or lifetime testing.
An easy-to-use parameter management allows to configure the measurement sequence and the evaluations quickly and easily.
Here is an excerpt of the many functions that our software provides:
- User administration and password protected login
- System parameter administration (for sequence control and hardware configuration)
- Test parameter administration (for the definition of the measurement and evaluation)
- Test sequencer for sequence control
- Display of measured values as force/displacement diagram (force/displacement diagram or force/time diagram and displacement/time diagram)
- Various parameterizable evaluation functions (extreme values, differences, positions)
- Configuration as laboratory testing device or for series production or end-of-line testing
- Configurable stepwise testing (force steps and/or travel steps)
- Storage of measured values in binary and/or CSV format
- Measurement curves saved in binary format can be reloaded, displayed and analyzed (also with the evaluation functions)
- Configurable low-pass filter for the measured value diagrams
- Editable scaling factor and offset of the values measured in volts into physical units N and mm
- Editable compensation of force sensor deformation (optional, force-dependent, if known)
- Editable calibration factor and offset
- Separate assignment of product/product number to parameter sets possible (for deviating package sizes or test item appearance with otherwise identical properties)
- Packaging unit counter with prompt for packaging change
- Error counter with top five statistics
- Extensive diagnostic functionality (complete diagnosis of the system by manual operation)
- Universal measurement functions for e.g. simple measurement (outward path only) or hysteresis curve measurement (outward and return path)
- Depending on the application, the measurement can be configured as a pressure test or as a tensile test (for pressure measurement the home position is at the top, for tensile measurement the home position is at the bottom)
- Extensive and universal evaluation functions such as minima, maxima, defined measuring points (by position, difference, single value and number)
Further customer-specific requirements and measurement or evaluation functions can be implemented at short notice!
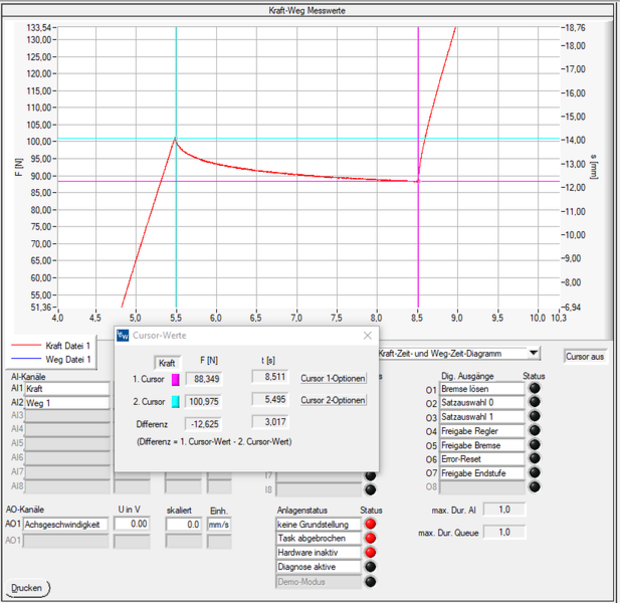
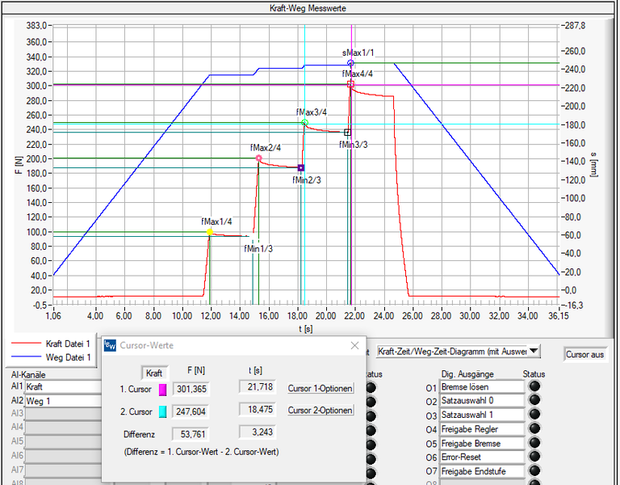
Cursor function for precise analysis of measured diagrams
FDM 3.0 - Cursor function for measuring individual measured values Cursor function in force-displacement diagram, temporal
Cursors can be used to precisely measure specific points in the diagram. The cursors can be easily operated and positioned at any point of the curves.
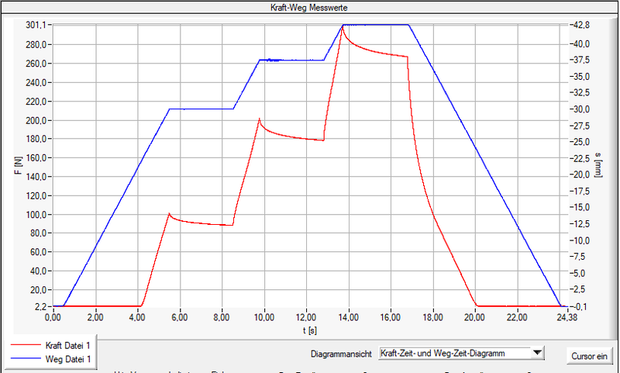
Representation also as force-time and displacement-time diagrams
The representation of the measured values is not only possible as force/displacement diagram, but also as time diagram, i.e. force and displacement over time (temporal representation).
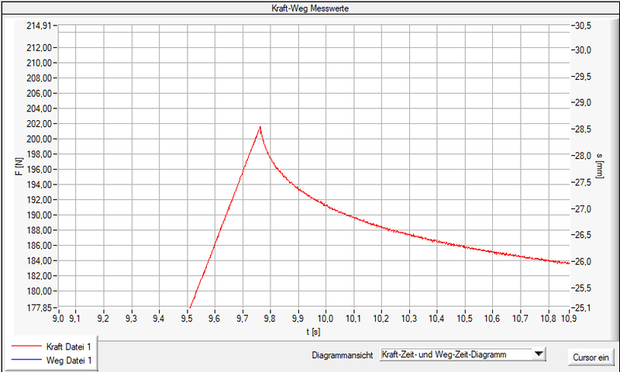
Examine interesting points in detail with the zoom function
With the help of the zoom function you can zoom in at any point of the diagram and get a more detailed view of the measured values at this point.
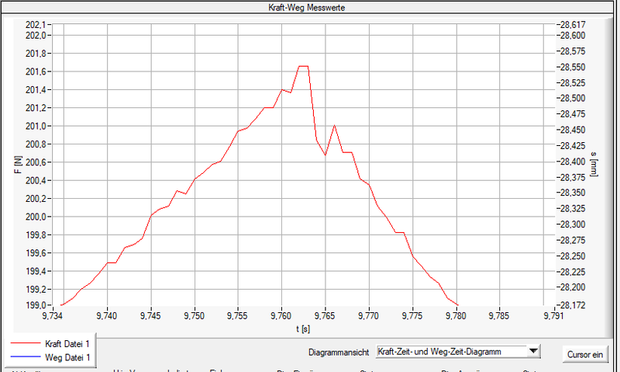
Zooming to the single measured value
If you want to know exactly, KWM 3.0 allows you to "zoom in" so deeply into the diagram that even the individual measured values become visible.
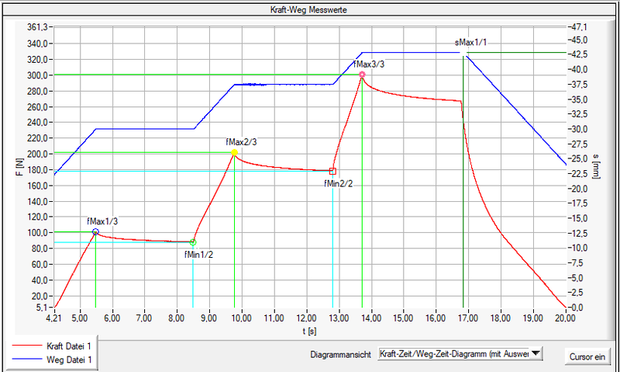
Determine extreme values (minima and maxima) in the measured values automatically
With the help of the extreme value function, the minima and maxima (highs and lows) can be determined automatically and marked in the diagram.
For the limitation of the relevant extreme values, specifications for the search can be made via the parameters Extreme value amplitude and Search threshold.
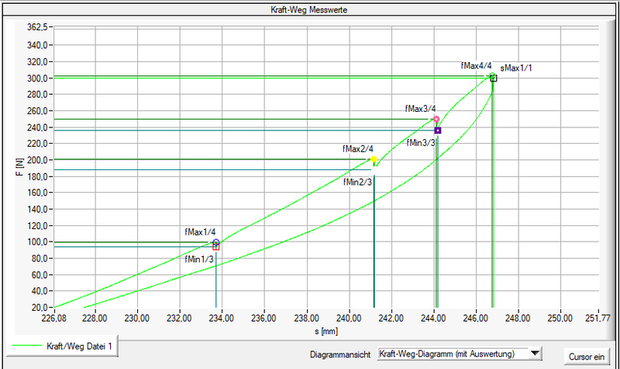
The extreme values (i.e. the mimima and maxima) can be displayed both in the time view of the diagram (force/time and displacement/time diagrams) and in the force/displacement view of the diagram.
The extreme values can be checked separately by mimima and maxima and by force or displacement.
Of course, the zoom and cursor functionality also works together with the extreme value display.
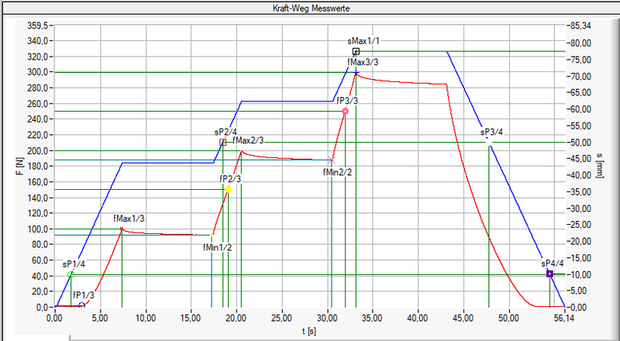
Search defined measuring points in measured diagram automatically
In addition to the extreme values (minima and maxima), certain defined measuring points can be determined automatically and marked in the diagram.
These measuring points can be used, as well as the extreme values, for the evaluation after Anzhal, position, single value and difference. Of course also in combination with the extreme values.
You are looking for a Force-Displacement Measuring Software?
This is the right place!
Contact us for your software licence.